The Bridge Creek-Moore Tornado of May 3, 1999, in Oklahoma, holds the record for the strongest measured tornado winds at 321 mph. This F5-rated tornado carved a 38-mile path over 85 minutes, causing $1.2 billion in damage and 41 fatalities. The measurement was captured by mobile Doppler radar technology, surpassing the previous records. While other tornadoes like El Reno have approached this strength, the precise measurement techniques reveal fascinating details about these spectacular storms.
Key Takeaways
- The Bridge Creek-Moore Tornado of May 3, 1999, holds the record for strongest recorded wind speeds at 321 mph.
- The El Reno Tornado of May 31, 2013, reached wind speeds of 313 mph and became the widest tornado ever at 2.6 miles.
- Mobile Doppler radar systems have confirmed multiple tornadoes with wind speeds exceeding 300 mph since the 1990s.
- The Tri-State Tornado of 1925 holds the record for longest tracked path at 219 miles.
- Multi-vortex tornadoes, like Bridge Creek-Moore, can produce extreme wind speeds through complex rotation patterns with multiple subvortices.
Defining Tornado Strength: Wind Speed vs. Damage
The measurement of tornado strength relies on two primary metrics: wind speed and damage assessment. The Enhanced Fujita Scale (EF Scale) categorizes tornadoes from EF0 to EF5 based on estimated wind speeds ranging from 65 mph to over 200 mph. These estimates are derived from analyzing structural damage rather than direct measurements.
While Doppler radar and photogrammetry have recorded maximum tangential wind speeds of 280-360 mph, the EF Scale utilizes 28 damage indicators and 12 degrees of damage to estimate wind speeds more accurately. National Weather Service teams conduct detailed surveys, examining regional construction variations and damage patterns to determine classifications. T. Theodore Fujita first established this damage-based classification approach in 1971.
The scale divides tornadoes into three broad categories: weak (EF0-EF1), strong (EF2-EF3), and violent (EF4-EF5). Although the EF Scale improved upon its predecessor by providing better correlation between wind speeds and damage, limitations persist, particularly in cases where tornadoes do not encounter structures for assessment.
The Record-Breaking Bridge Creek-Moore Tornado

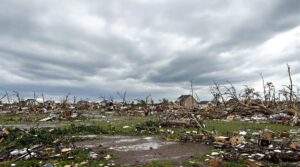
On May 3, 1999, a catastrophic F5 tornado carved a 38-mile path through Oklahoma, setting a world record with measured wind speeds of 321 mph (517 km/h). This unprecedented event, known as the Bridge Creek-Moore tornado, prompted significant advances in tornado preparedness strategies and community resilience initiatives across the region.
| Impact Category | Statistics |
|---|---|
| Duration | 85 minutes |
| Path Length | 38 miles |
| Total Deaths | 41 people |
| Injuries | 583 people |
| Economic Cost | $1.2 billion |
The tornado's devastating impact led to the first-ever tornado emergency statement by the National Weather Service, fundamentally changing severe weather communication protocols. As part of a larger outbreak that produced 71 tornadoes across five states, this supercell caused extensive destruction, destroying over 8,000 homes and structures. Ground scouring and debarked trees evidenced the tornado's extreme intensity, while its unprecedented wind speeds remain the highest ever recorded on Earth. President Bill Clinton signed a major disaster declaration the following day to provide federal aid for recovery efforts.
El Reno: A Monster in Oklahoma

Moving beyond the record-breaking wind speeds of the Bridge Creek-Moore tornado, another historic Oklahoma twister emerged on May 31, 2013, when an EF3 tornado struck Canadian County near El Reno. This massive storm system set a record as the widest tornado ever documented, spanning 2.6 miles across.
While officially rated EF3 based on ground damage, radar data revealed extraordinary tornado wind measurements aloft. The El Reno tornado's intensity reached unprecedented levels, with mobile radar detecting winds up to 313 mph within its multiple subvortices.
The system tracked 16.2 miles across rural areas south of El Reno, Oklahoma, lasting 40 minutes and causing $35-40 million in damage. Despite initial debates about its rating between EF3 and EF5, the final classification remained EF3 due to the disconnect between radar-measured winds and observed surface destruction.
The event claimed eight lives, including noted storm chaser Tim Samaras, and injured 151 people. The storm developed under conditions of high dewpoint values reaching into the lower 70s°F.
Historical Methods of Measuring Tornado Power

The scientific measurement of tornado intensity began with basic weather station records in the early 20th century, which provided limited data from fixed locations that tornadoes happened to cross.
Dr. Theodore Fujita developed the original F Scale to standardize tornado measurement through damage assessment before more advanced technologies existed.
Mobile Doppler radar technology emerged in the 1970s, revolutionizing tornado observation by enabling scientists to collect real-time wind speed data from safe distances while following storm systems.
Ground damage analysis evolved from simple visual assessments to the sophisticated Enhanced Fujita Scale implemented in 2007, which correlates specific structural damage patterns with estimated wind speeds through a standardized evaluation process.
Early Weather Station Records
Early meteorological efforts to measure tornado intensity relied heavily on pioneering instruments developed in the late 20th century. Initial tornado records came from instruments like TOTO (1981-1983) and HITPR (1997), which provided groundbreaking data on pressure drops and wind dynamics within tornado cores. The invention of the Doppler On Wheels revolutionized how scientists could collect mobile tornado data.
| Instrument | Time Period | Key Measurements |
|---|---|---|
| TOTO | 1981-1983 | Pressure, wind, temperature |
| HITPR | 1997-2003 | 100 mbar pressure drop |
| Waterspout Probe | 1974 | Dynamic/static pressure |
| E-Turtles | 1994-1995 | 50 mbar pressure deficit |
| Airborne Systems | 1974-1980s | Vortex characteristics |
These early instruments, though limited by deployment challenges, established foundational data collection methods. HITPR significantly recorded a noteworthy 100 mbar pressure drop in 2003, while E-Turtles documented a 50 mbar deficit near Allison, Texas in 1995, marking vital milestones in tornado measurement history.
Mobile Doppler Radar Evolution
Scientific breakthroughs in tornado measurement arrived with mobile Doppler radar technology during the late 1900s, revolutionizing researchers' ability to analyze tornadic winds and structures.
The first significant mobile radar advancements emerged with the Doppler on Wheels deployment in 1994-1995, leading to unprecedented documentation of tornado characteristics and wind patterns.
Tornado detection technology continued evolving with the development of RaXPol in 2011 and HORUS in 2023, the first mobile phased array radar.
These systems achieved remarkable capabilities, including wind speed measurements up to 336 mph at close range, detailed analysis of multi-vortex structures, and rapid scanning intervals of one minute.
The technology enabled precise verification of damage paths and provided quantitative measurements of tornado size, including a record core flow circulation of 1,600 meters.
Ground Damage Analysis Methods
Throughout meteorological history, measuring tornado intensity relied primarily on ground-based damage assessment methods, with the Fujita Scale serving as the cornerstone of tornado classification from 1971 to 2007.
This original scale evaluated ground impact through 13 theoretical levels, though only F0-F5 were used practically, corresponding to wind speeds between 40-261 mph.
The Enhanced Fujita Scale, implemented in 2007, refined damage assessment methodology by introducing specific damage indicators and degrees of damage.
This system enables more accurate wind speed estimations based on observed structural impacts.
Recent developments include seismic wave analysis, which measures ground vibrations produced by tornadoes.
Though still experimental, this technique offers potential for quantitative measurement of tornado intensity, particularly useful when combined with traditional damage surveys conducted by National Weather Service personnel.
The Evolution of Tornado Measurement Technology

As weather researchers sought to better understand tornadic phenomena in the 1970s, the development of mobile Doppler radar systems marked a pivotal advancement in tornado measurement technology.
The Joint Doppler Operational Project in 1976 demonstrated that Doppler radar could notably improve severe storm and tornado warnings, leading to radar technology evolution across meteorological institutions.
Key tornado detection advancements emerged through several breakthrough developments:
- Dual-polarization radar technology enabled detection of tornado debris, even in low-visibility conditions.
- Phased Array Radar systems achieved five times faster scanning capabilities than conventional radar.
- The New Tornado Detection Algorithm (NTDA) integrated machine learning to calculate tornado probabilities.
Modern measurement systems now incorporate artificial intelligence, with innovations like TorNet AI datasets and Doppler on Wheels (DOW) providing unprecedented data on tornado structure and behavior.
These technologies deliver high-resolution measurements of peak winds and complex multi-vortex formations, revolutionizing our understanding of tornadic systems.
Breaking Down the Fujita Scale

The Fujita Scale, established in 1971 by Dr. Ted Fujita of the University of Chicago, revolutionized tornado damage assessment techniques by introducing a standardized method for rating tornado intensity.
The scale categorizes tornadoes into six levels, from F0 to F5, based on observed damage patterns and corresponding wind speeds.
The classification system begins with F0 tornadoes, producing light damage at wind speeds of 40-72 mph, and progresses through increasingly severe categories.
F2-F3 tornadoes, with winds of 113-206 mph, cause considerable to severe structural damage, while F4 tornadoes generate devastating damage with winds reaching 260 mph. In the aftermath of such destructive events, homeowners must prioritize safety and resilience in their rebuilding efforts. Implementing tornado roof installation tips can significantly enhance the durability of structures, helping to withstand future storms. Additionally, ensuring proper anchoring and using suitable materials can make a substantial difference in mitigating damage during severe weather.
The Fujita Scale overview demonstrates how each category correlates specific wind speeds with characteristic damage patterns, from damaged chimneys at F0 to leveled buildings at F4.
The scale underwent significant evolution, ultimately being replaced by the Enhanced Fujita Scale in 2007 to address wind speed overestimation issues and incorporate more precise damage indicators.
Multi-Vortex Tornadoes and Their Intensity

Multi-vortex tornadoes exhibit complex rotation patterns where multiple subvortices orbit within the main circulation, creating localized areas of extreme wind speeds.
These suction vortices can add over 100 mph to the ground-relative wind speeds, producing narrow arcs of intense destruction adjacent to areas of minimal damage.
The most intense documented wind speeds from multi-vortex tornadoes include the 1999 Bridge Creek-Moore tornado at 321 mph (517 km/h) and the 2013 El Reno tornado at 313 mph (504 km/h).
Vortex Rotation Patterns
Powerful rotation patterns characterize multi-vortex tornadoes, where several subvortices revolve around a central vortex core, intensifying their destructive potential.
The vortex dynamics create complex wind patterns that can add over 100 mph to the ground-relative wind speeds within the tornado circulation, dramatically increasing vortex intensity.
These rotation patterns manifest in three distinct ways:
- Multiple vortices form through the interaction of cyclonically incoming and rising air motions.
- Subvortices develop after vortex breakdown reaches the surface.
- Satellite tornadoes may form outside the main circulation through separate mechanisms.
Research utilizing Doppler radar and computer simulations has documented these intricate rotation patterns, revealing how they contribute to the extreme destruction observed in notable events like the El Reno and Bridge Creek-Moore tornadoes.
Extreme Wind Speed Locations
Ground-breaking Doppler radar measurements have documented extreme wind speeds in multi-vortex tornadoes, with the highest recorded velocity reaching 321 mph during the 1999 Bridge Creek-Moore tornado in Oklahoma.
Radar technology has revealed complex vortex dynamics in these storms, with multiple suction vortices rotating within the main circulation, often intensifying wind speeds by over 100 mph.
Historical records and meteorological studies indicate consistently extreme velocities in multi-vortex formations, exemplified by the 2013 El Reno tornado's 313 mph winds and the Mulhall tornado's 257 mph measurement.
These storm patterns create narrow arcs of intense destruction, as documented through damage assessment protocols.
Understanding tornado formation and atmospheric conditions that generate such extreme wind speeds remains essential for advancing measurement accuracy and forecasting capabilities.
Notable Contenders for Strongest Tornado

Several tornadoes throughout history have demonstrated extraordinary strength across different metrics, including wind speed, path width, track length, and destructive power.
When analyzing tornado intensity factors and tornado outbreak patterns, specific events emerge as particularly notable for their extreme characteristics.
Top contenders for strongest tornado include:
- Bridge Creek, Oklahoma (1999) – Recorded the highest documented wind speed at 321 mph (517 km/h)
- El Reno, Oklahoma (2013) – Combined record-breaking width of 2.6 miles with wind speeds of 313 mph
- Tri-State tornado (1925) – Maintains the longest tracked path at 219 miles with 695 fatalities
While wind speed often dominates strength discussions, the El Reno tornado exemplifies how multiple factors contribute to overall intensity.
Its combination of near-record winds and unprecedented width makes it a significant contender for strongest tornado, demonstrating how various metrics must be considered when evaluating tornado strength.
The Role of Doppler on Wheels in Wind Speed Detection

Doppler on Wheels (DOW) technology represents a significant advancement in tornado wind speed detection, providing mobile radar units capable of measuring velocities up to 318 mph at heights of 30-50 meters above ground level.
The system's rapid 7-second scanning rate enables real-time tracking of wind patterns and intensity variations within tornado structures.
DOW's high-resolution data collection has proven instrumental in identifying multiple vortex signatures and complex wind field dynamics, particularly in record-breaking tornadoes such as those documented in Greenfield, Iowa and Bridge Creek, Oklahoma.
Mobile Radar Technology Advances
Modern mobile radar technology has revolutionized tornado research through the implementation of Doppler on Wheels (DOW) systems, which have been deployed over 200 times since 1995 across multiple continents.
These mobile radar innovations utilize sophisticated detection capabilities, including dual-polarization radar systems and rapid-scan phased array antennas.
Key storm tracking advancements include:
- C-band configurations featuring two 1 MW transmitters with dual-polarization capabilities
- X-band systems incorporating both 250 kW and 40 kW TWT transmitters
- Integration with GURU software for enhanced data processing
The technology provides unprecedented data collection, with 7-second scan cycles at heights of 100-160 feet above ground.
When combined with Mobile Mesonets and deployable weather stations, these systems create a thorough network for atmospheric observation through the Flexible Array of Radars and Mesonets (FARM).
Real-Time Wind Measurements
The groundbreaking implementation of real-time wind measurements through DOW systems has yielded unprecedented data on tornado wind speeds, including the record-breaking 309-318 mph velocities recorded in Greenfield, Iowa in May 2024.
These measurements, taken at heights of 100-160 feet above ground every 7 seconds, provided essential real-time data for tornado analysis.
DOW's truck-mounted Doppler radar captures velocity readings in conditions where traditional measurements are unfeasible.
While peak winds typically occur briefly in narrow regions on tornadoes' right sides, DOW directly records Doppler velocities up to 271 mph.
Scientists calculate final wind speeds using established methodologies, acknowledging inherent measurement uncertainties.
Prior to Greenfield, only two other tornadoes had documented speeds exceeding 300 mph through DOW measurements, including the 264 mph recording in Bennington, Kansas.
Multiple Vortex Detection Methods
Building upon established wind measurement capabilities, multiple vortex detection methods have expanded scientific understanding of tornadic wind behavior through advanced radar technologies.
Doppler on Wheels (DOW) systems, utilizing X-band and C-band frequencies, have revolutionized how researchers analyze vortex characteristics in real-time. These detection technologies enable precise measurements of wind velocities every few seconds, documenting speeds exceeding 300 mph in extreme cases.
Key advancements in mobile radar deployment include:
- Truck-mounted DOW units providing rapid positioning for ideal data collection
- Multi-frequency radar systems capturing detailed wind profiles at various heights
- Integration of multiple radar platforms, including RaXPol and Ka-band systems, enabling thorough vortex analysis
This technological framework has yielded unprecedented insights into tornadic structure, particularly in documenting record-breaking events like the Bridge Creek-Moore and Greenfield tornadoes.
Analyzing Path Width and Storm Duration

Analyzing tornado path characteristics reveals that the El Reno, Oklahoma tornado of 2013 set a record for maximum width at 2.6 miles (4.2 km), while the historic Tri-State tornado of 1925 maintains the longest documented path length at 219 miles (352 km) and duration at 3.5 hours.
Tornado path analysis indicates several other notable wide-path storms, including the Hallam, Nebraska (2004) and Jiangsu, China (2016) tornadoes, both reaching approximately 2.5 miles in width.
The Edmonson, Texas tornado of 1968 measured between 2-3 miles wide. Storm duration impact varies greatly among major tornadoes, with documented cases ranging from the brief but devastating 37-minute Joplin tornado of 2011 to the hour-long Bridge Creek tornado of 1999.
While path width often correlates with storm intensity, duration and path length can provide additional metrics for evaluating overall tornado strength and potential destructive capacity.
Impact of Geography on Tornado Strength

Geographic features play an essential role in tornado development and intensity, as evidenced by research showing that variations in terrain and surface roughness can greatly affect storm behavior.
Studies of tornado topography, particularly in Alabama and Georgia, demonstrate that storms often reach peak strength near higher elevations, while changes in surface features can influence tornado formation and intensity.
Research has identified several key factors regarding geographic impacts:
- Abrupt shifts between different landscape types, such as urban-to-rural areas, increase tornado touchdown probability.
- Surface roughness, including forested mountainous regions, can cause tornadoes to become stronger and wider.
- Terrain elevation changes frequently correspond with variations in tornado intensity.
Analysis of Indiana tornado climatology supports these findings, revealing that 61% of touchdowns occurred within 1 km of urban areas and 43% near forests.
While the relationship between land surface heterogeneity and tornadogenesis requires further study, evidence suggests that geographic features substantially influence tornado behavior and strength.
Scientific Debates on Maximum Possible Wind Speeds

The scientific community continues to debate the maximum possible wind speeds achievable in tornadoes, with theoretical calculations suggesting tangential speeds could reach 450-575 km/h (280-360 mph).
Obtaining accurate measurements presents significant challenges, as direct observations are rare and typically rely on mobile Doppler radar units positioned safely outside the tornado's core.
The most reliable data comes from specialized instruments like Doppler on Wheels systems, which have documented extreme winds up to 336 mph (541 km/h) in events such as the 2013 El Reno tornado.
Wind Speed Measurement Challenges
Scientists face significant challenges when measuring tornado wind speeds, particularly due to discrepancies between radar-estimated and damage-estimated measurements. Key factors contributing to measurement uncertainty include radar readings taken above ground level, instrument damage during storms, and complex wind field interactions.
The Enhanced Fujita (EF) scale relies on damage indicators to estimate wind speeds, but several limitations affect accuracy:
- Direct field measurements are often impossible due to instrument destruction and radar beam blockage.
- Damage assessments can underestimate wind speeds, especially in areas with low housing density.
- Subvortices within tornadoes may produce maximum wind speeds that current methods cannot capture.
These challenges make it difficult to definitively determine the strongest tornado ever recorded, as both radar and damage-based measurements have inherent limitations in capturing extreme wind speeds.
Theoretical Maximum Speed Limits
While historical tornado records have documented wind speeds up to 321 mph, theoretical maximum wind speeds in tornadoes remain a subject of intense scientific debate.
Research suggests that under specific atmospheric conditions, tornado wind speeds could theoretically exceed 400 mph, though such extremes have not been confirmed in nature.
The theoretical implications of these potential maximum speeds have led scientists to continuously refine their wind speed estimates through advanced Doppler radar measurements and 3D structural analysis.
Current research focuses on integrating multiple data sources to better understand the upper limits of tornado intensity.
This ongoing investigation is particularly relevant as climate change may influence storm intensity patterns, prompting scientists to reevaluate existing measurement scales and classification systems for extreme weather events.
Comparing International Tornado Records

Records from international tornado data reveal significant variations in wind speeds, path lengths, and fatalities across different regions and time periods. Historical comparisons of tornado intensity demonstrate that Oklahoma has experienced the most powerful documented wind speeds, with the 2013 El Reno tornado reaching up to 336 mph (541 km/h), followed by the 1999 Bridge Creek tornado at 321 mph (517 km/h).
Notable international tornado records include:
- Highest Wind Speed: El Reno, Oklahoma (2013) – 336 mph
- Longest Path Length: Tri-State Tornado (1925) – 219 miles
- Most Fatalities: Daulatpur-Saturia, Bangladesh (1989) – 1,300 deaths
The data indicates that while North America experiences the most intense tornadoes based on wind speed measurements, the deadliest tornadoes have occurred in South Asia.
The Tri-State Tornado of 1925 remains exceptional, holding both the record for the longest path length and ranking as the second deadliest tornado in recorded history.
The Challenge of Accurate Wind Speed Measurements

Measuring the true wind speeds of tornadoes presents significant technical challenges due to the violent, chaotic nature of these atmospheric phenomena. Current measurement technology struggles with direct data collection, forcing scientists to rely on multiple assessment methods for wind speed estimation. Damage surveys compare structural impacts against standardized indicators, while Doppler radar provides velocity data from a distance.
| Method | Advantages | Limitations |
|---|---|---|
| Anemometers | Direct measurement | Cannot survive tornado conditions |
| Damage Surveys | Standardized indicators | Relies on available structures |
| Doppler Radar | Remote sensing capability | Limited near-surface accuracy |
| Computer Modeling | Complex analysis possible | Requires validation |
| EF Scale | Systematic approach | Based on estimates |
Computer modeling helps reconcile disparities between radar measurements and damage assessments, particularly in strong-violent tornadoes where radar-estimated speeds often exceed damage-based calculations. The integration of multiple analytical approaches, including sophisticated modeling and detailed damage analysis, continues to refine the accuracy of tornado intensity assessments.
Future of Tornado Strength Detection Methods

Modern tornado detection methods are undergoing a revolutionary transformation through the integration of artificial intelligence, advanced radar systems, and satellite technologies. AI advancements have demonstrated impressive capabilities, with machine learning models correctly identifying 85% of EF-2 or stronger tornadoes.
Satellite integration is eliminating traditional radar limitations by providing extensive coverage without terrain interference.
Future predictions for tornado detection include:
- Enhanced accuracy through NSSL's New Tornado Detection Algorithm (NTDA), which combines machine learning with dual-polarization radar data
- Improved warning systems using the Multi-Radar, Multi-Sensor (MRMS) system to map and verify tornado formations
- More precise strength assessments through integrated analysis of electrical charge patterns and lightning frequency variations
These technological developments, particularly in phased array radar and AI-driven analysis, promise to revolutionize tornado detection accuracy while reducing false alarms, ultimately leading to more reliable strength measurements and public safety notifications.
The Benefits Of Consulting A Public Adjuster

Professional public adjusters provide critical expertise in evaluating tornado damage and maneuvering complex insurance claims processes.
Their objective evaluations and thorough documentation methods typically result in higher claim settlements compared to self-filed claims.
Through their specialized knowledge of policy terms and industry practices, public adjusters streamline the claims process while maximizing coverage benefits for property owners affected by severe weather events.
Studies show that policyholders working with licensed public adjusters can receive settlement increases of up to 800% for catastrophic weather claims.
Expertise In Insurance Claims
When disaster strikes and insurance claims become necessary, public adjusters offer invaluable expertise in maximizing claim settlements for policyholders. Their extensive knowledge of insurance policies and procedures enables effective insurance negotiations that often result in higher payouts, as evidenced by studies showing an average increase of $3,607 in claim settlements when utilizing their services.
Public adjusters possess specialized expertise in:
- Extensive damage assessment and accurate replacement value calculations
- Documentation preparation and submission requirements for expedited processing
- Strategic claim presentation and professional insurance negotiations
These licensed professionals understand the intricacies of policy coverage and maintain current knowledge of state regulations.
Their technical expertise allows them to identify all compensable damages, ensuring thorough documentation and proper valuation during the claims process, ultimately leading to more favorable settlements for policyholders.
Unlike insurance adjusters who work for insurance companies, public adjusters charge up to 10% commission of the final settlement amount to align their interests with those of the policyholder.
Objective Damage Assessment
Through extensive damage assessment protocols, public adjusters provide an objective evaluation framework that greatly enhances the accuracy and completeness of insurance claims. Their professional expertise enables thorough identification of both visible and concealed damages, ensuring proper documentation and quantification of losses.
Public adjusters conduct systematic damage evaluations using established methodologies that align with insurance policies and regulations. Their objective assessment approach includes detailed documentation, professional valuation of damages, and thorough analysis of policy coverage.
These specialists serve as advocates for policyholders while maintaining professional neutrality in their evaluations, preventing potential underestimation of damages and ensuring fair compensation. They navigate complex claim processes by preparing detailed reports, managing required documentation, and facilitating effective communication between policyholders and insurance companies throughout the settlement process. Operating on a contingency fee basis, public adjusters typically charge between 5-20% of the final settlement amount, making their services accessible to most policyholders.
Streamlined Claim Process
A streamlined claims process managed by public adjusters greatly reduces processing time while maximizing claim outcomes for policyholders. Through expert documentation management and professional advocacy, public adjusters enhance claims efficiency while minimizing delays in settlements.
Their specialized knowledge guarantees complete and accurate submission of required materials, reducing processing bottlenecks and expediting claim resolution.
Key benefits of public adjuster involvement include:
- Automated workflow integration that accelerates claims processing and reduces operational costs
- Professional negotiation support that optimizes claim value through data-driven assessment
- Enhanced regulatory compliance and fraud detection capabilities that minimize investigation delays
This systematic approach to claims handling enables faster recovery for policyholders while maintaining transparency throughout the process, ultimately leading to improved satisfaction rates and more efficient settlements.
By adhering to strict ethical standards, PCAN members ensure fair treatment and honest representation throughout every step of the claims process.
Higher Claim Payouts & Settlements
Public adjusters greatly enhance insurance claim values through extensive damage assessment and strategic negotiation expertise. Their thorough evaluations identify all property damages, including often overlooked issues, while detailed documentation supports all-encompassing claims.
Through meticulous record-keeping and professional analysis, they guarantee maximum coverage under existing policies.
Their claim negotiation skills prove invaluable when dealing with insurance companies. Understanding common insurance tactics, they effectively advocate for policyholders while managing complex paperwork requirements.
Public adjusters obtain accurate repair estimates, compile proof of loss documentation, and present claims strategically to maximize settlements. Additionally, they reduce policyholder stress by handling time-consuming processes, from initial damage assessment to final resolution, while maintaining professional representation throughout the claims procedure.
With average settlements reaching $61,465 annually, public adjusters demonstrate significant value in maximizing insurance claim payouts for their clients.
About The Public Claims Adjusters Network (PCAN)

The Public Claims Adjusters Network stands as a thorough service organization dedicated to assisting policyholders throughout complex insurance claim processes. Its extensive claims assistance framework leverages experienced daily and catastrophe adjusters to deliver efficient policyholder support from initial notice of loss through final settlement.
PCAN's core operational elements include:
- Deployment of seasoned adjusters specializing in both routine and catastrophic events
- Implementation of versatile claims management solutions across diverse requirements
- Delivery of professional, empathetic service throughout the entire claims lifecycle
The network's expertise encompasses deep understanding of claims management complexities, utilizing industry-leading knowledge to navigate challenging situations.
Through its structured approach, PCAN maintains consistent quality and responsiveness while providing tailored solutions for various claim types. This systematic methodology guarantees policyholders receive extensive support backed by proven industry experience and technical proficiency.
Frequently Asked Questions
Can Tornadoes Form Over Water, and Are They as Strong as Land Tornadoes?
Tornadoes can form over water as waterspouts, occurring in two types: fair-weather and tornadic. While fair-weather waterspouts are typically weaker, tornadic waterspouts can achieve destructive wind strengths comparable to land tornadoes.
What's the Average Cost of Damage Caused by F5/Ef5 Tornadoes?
F5/EF5 tornadoes damage costs vary considerably, ranging from millions to billions per event, depending on population density, path characteristics, and infrastructure affected. No fixed average exists due to case-specific variables.
How Do Tornado Warning Systems Determine the Strength of an Approaching Tornado?
Warning systems utilize Doppler radar, weather spotters, and ground-based sensors to detect tornado formations, measuring wind speed patterns, rotation intensity, and debris signatures to determine approaching tornado strength.
Do Tornadoes Have a Specific Season or Can They Occur Year-Round?
While tornado seasons peak at specific times in different regions, tornadoes can occur year-round. Peak activity shifts from Southeast in winter months to Plains in spring/summer, following atmospheric and seasonal patterns.
What Percentage of Tornadoes Worldwide Occur in the United States?
While exact global tornado frequency data remains limited, the United States experiences approximately 1,200 of the world's documented tornadoes annually, representing the highest concentration in global distribution of these phenomena.
References
- https://en.wikipedia.org/wiki/Tornado_records
- https://www.metoffice.gov.uk/weather/learn-about/weather/types-of-weather/tornadoes/tornado-facts
- https://resources.newmeridiancorp.org/wp-content/uploads/2019/11/Grade-7-RST-Storm-Handscored-Materials-1.pdf
- https://wmo.asu.edu/content/tornado-highest-recorded-wind-speed-tornado-doppler-radar
- https://www.youtube.com/watch?v=af5KHZqdmZk
- https://www.weather.gov/oun/efscale
- https://www.britannica.com/science/tornado/Tornado-intensity
- https://www.accuweather.com/en/blogs-webinars/tornado-measurement-and-strength-decoding-the-ef-scale/1678027
- https://www.dnr.sc.gov/climate/sco/Education/facts/fujita.pdf
- https://en.wikipedia.org/wiki/1999_Moore_Tornado